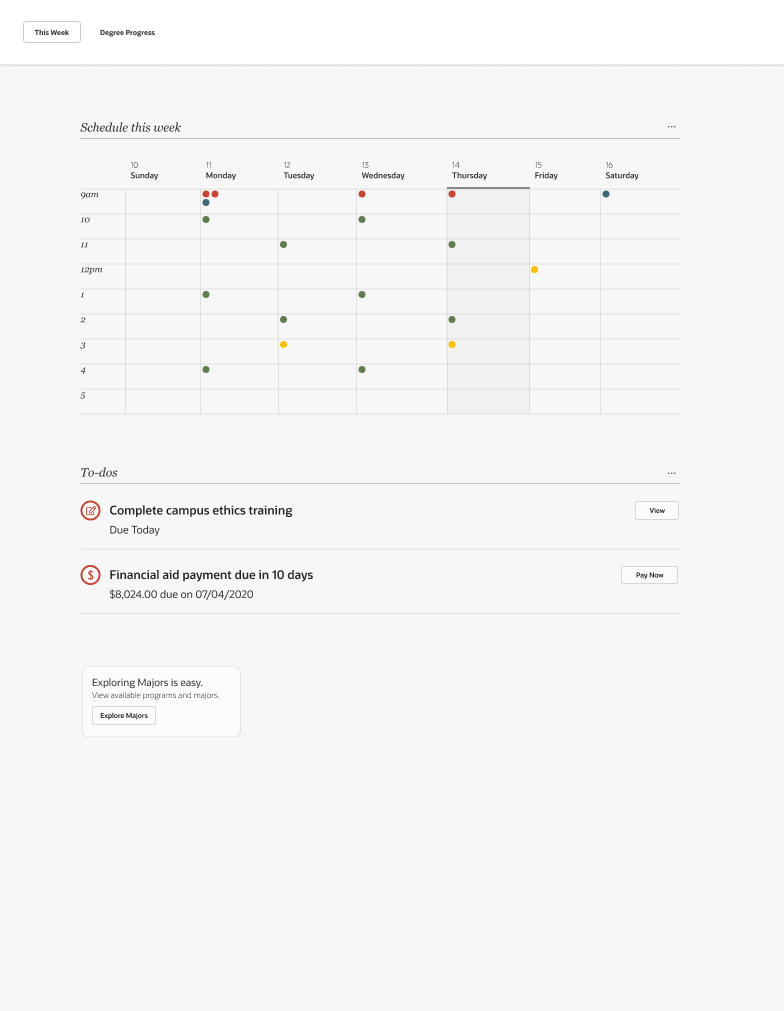
Student Journey Visual Mapping
- Role
- Product Designer
- Date
- 2021
- Company
- Oracle
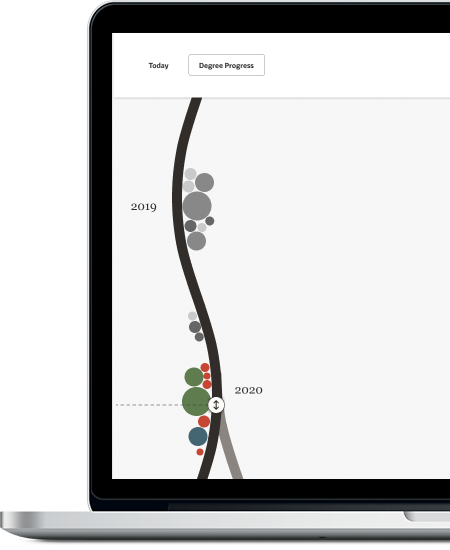
Concept work to help visualize the student path in higher education, from admissions to graduation and beyond.
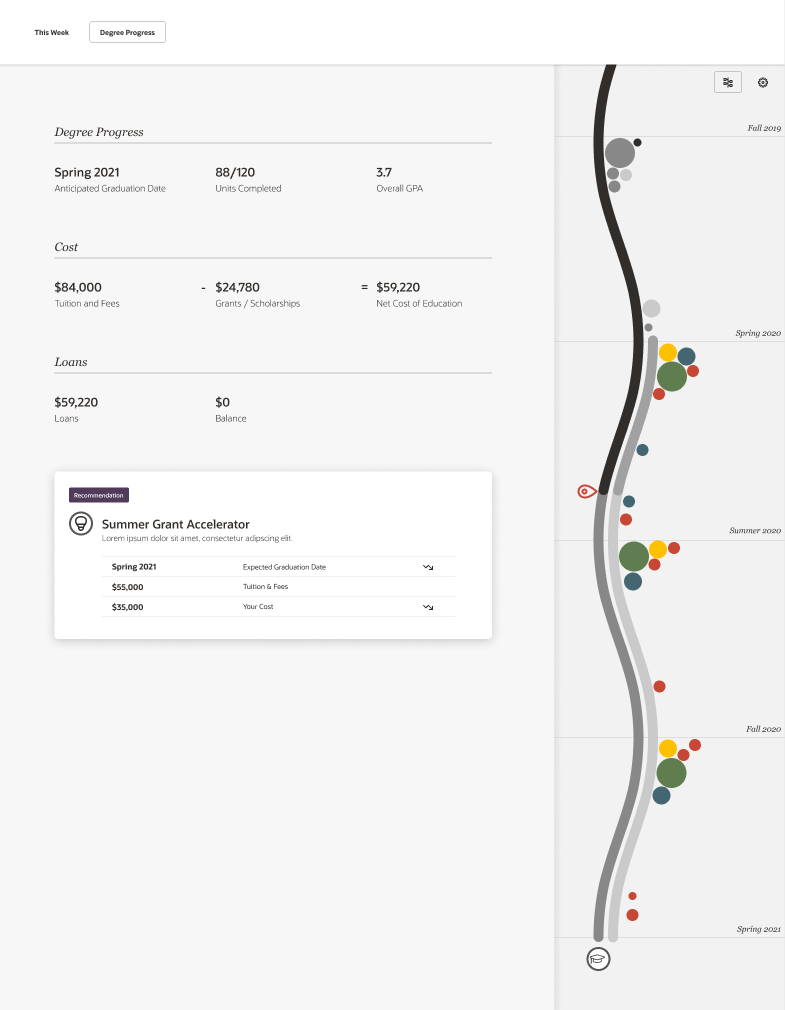
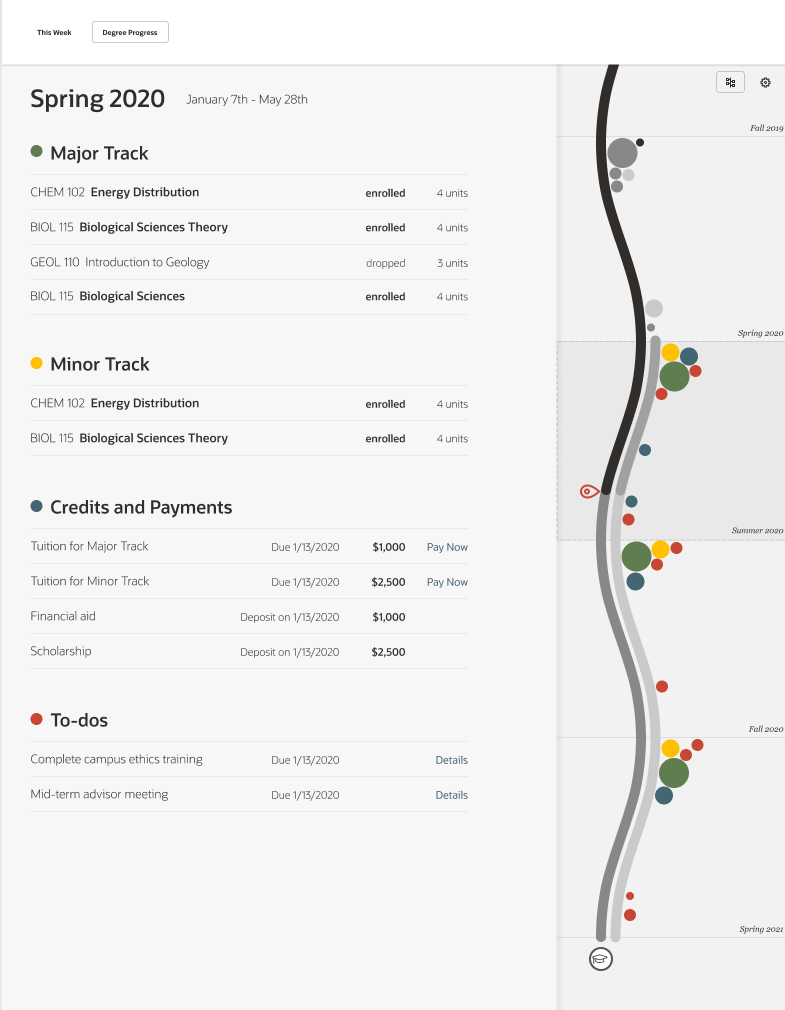
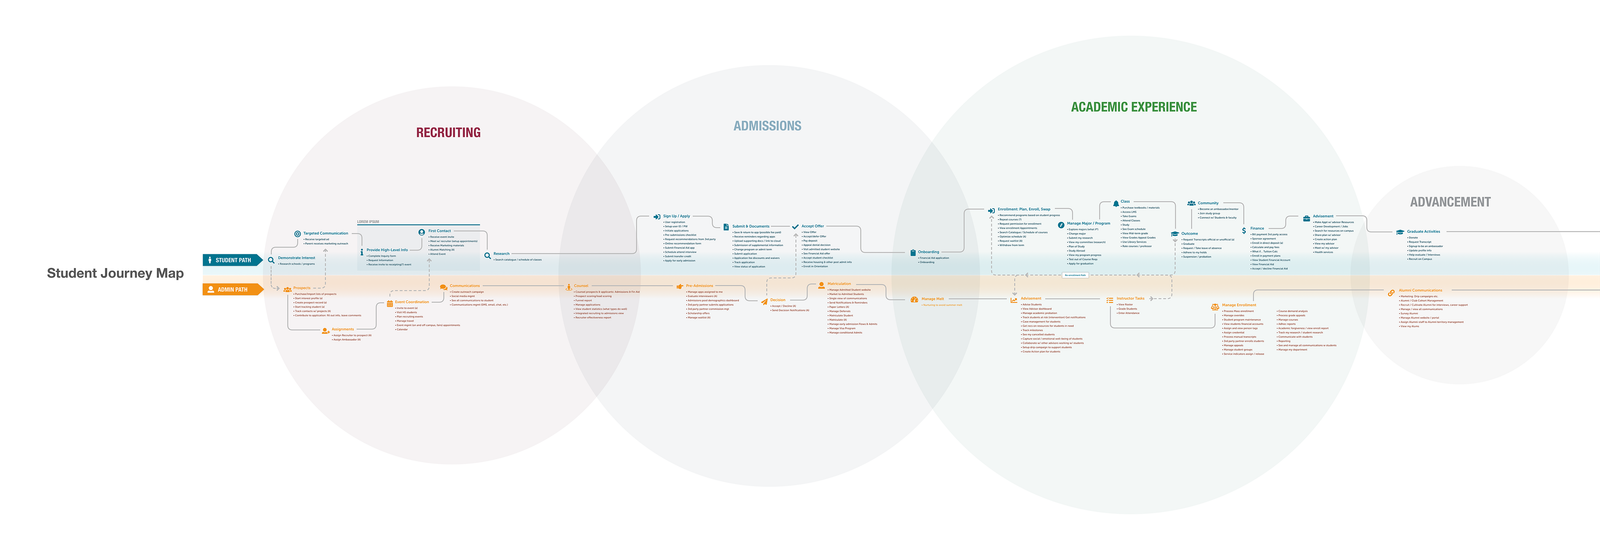
Traditionally, the ideal student path would be mapped out in one large visual. While comprehensive, it isn't the best format for interactivity and providing detail of a specific area. Provide an interface that allows students and admins to track progress and navigate through all areas of their path.
Rethinking the path as something organic, growing term by term toward graduation.

Early wireframes and explorations of how each student's path could be unique, like a fingerprint.
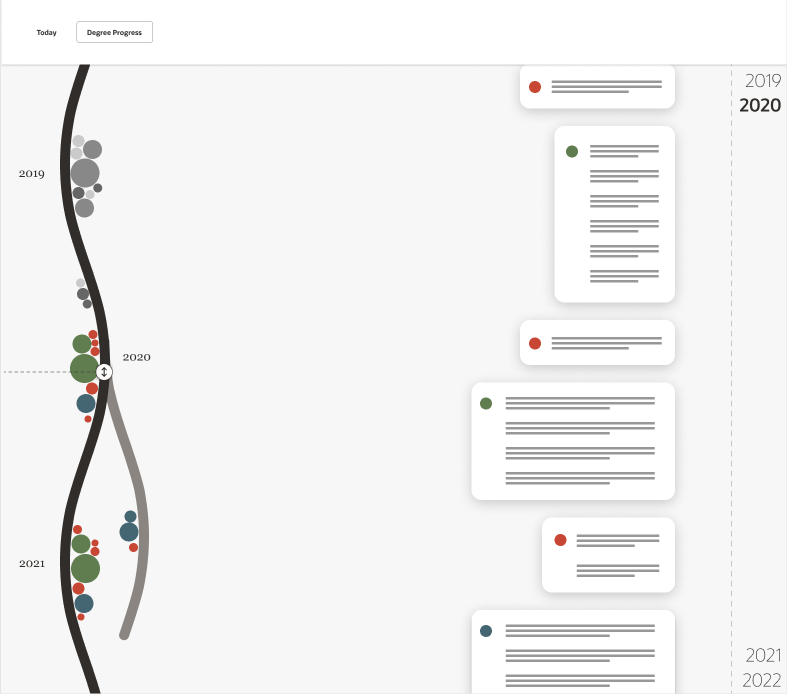
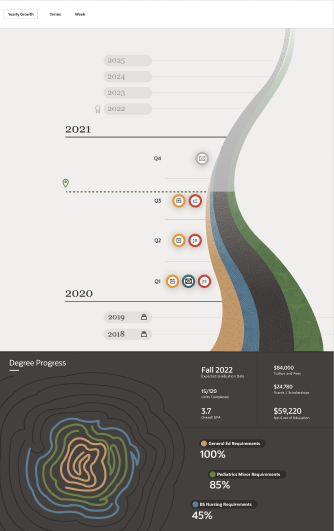
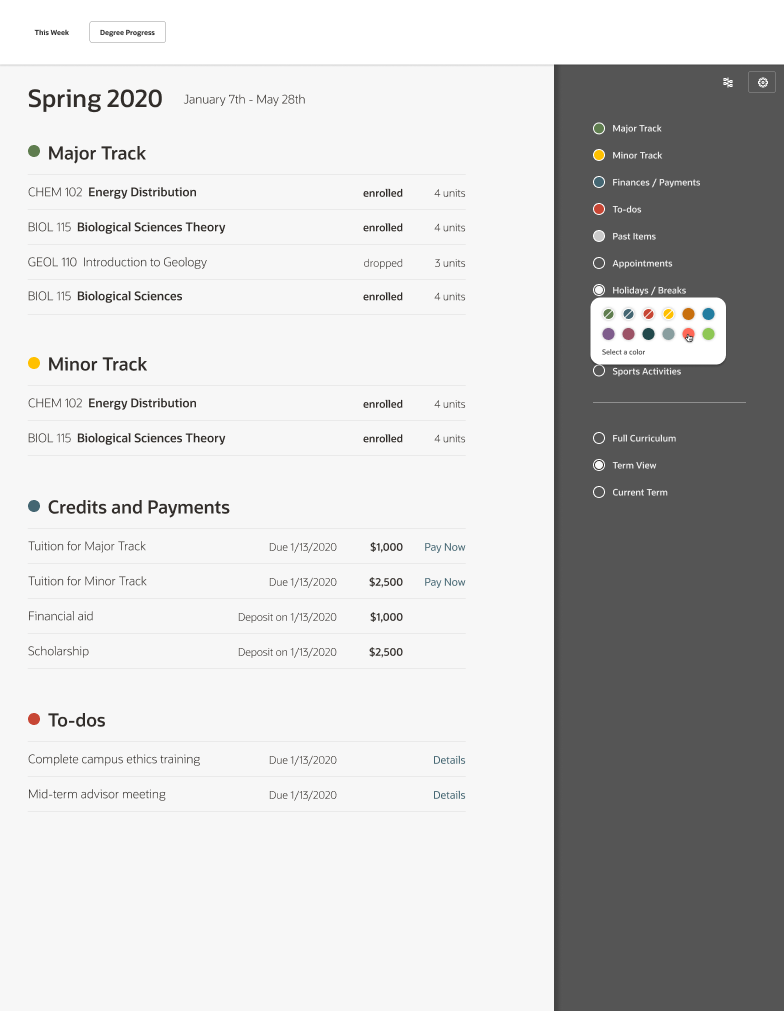
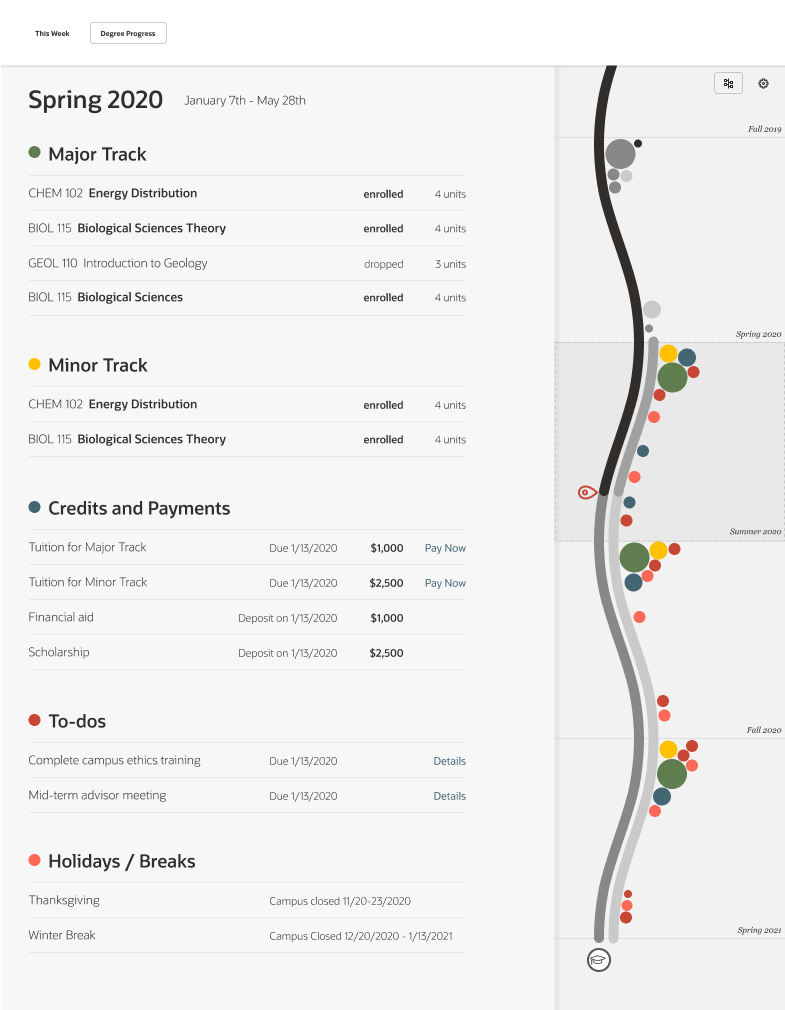
The path becomes an interactive timeline students can explore and customize.