Analytics Dashboard Concept

Role
Product Designer
Date
2016
Company
Ellie Mae
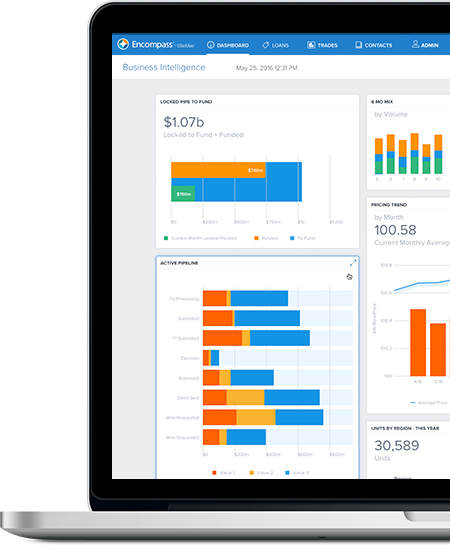
Encompass Business Intelligence dashboard shown on a laptop

Summary

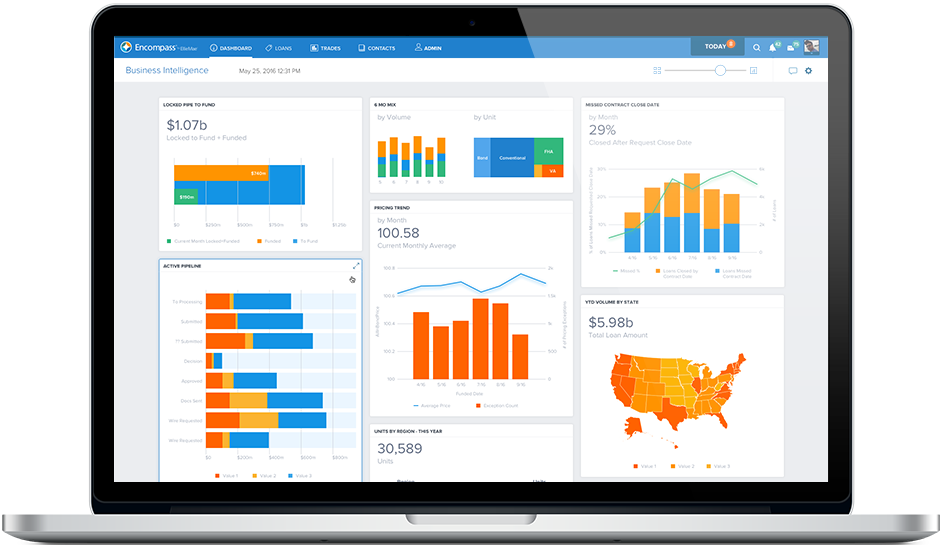
A concept for a Business Intelligence dashboard in Encompass, Ellie Mae’s mortgage platform. Lenders get an at-a-glance view of their pipeline, pricing trends and loan volume, with each chart able to expand into a detailed, interactive view and a settings panel for choosing which charts appear.
Concepts

Business Intelligence dashboard with charts for locked pipe to fund, pricing trend, active pipeline and YTD volume by state
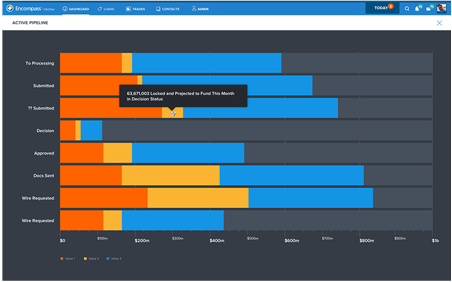
Active Pipeline chart expanded to full screen with a tooltip on one bar
Expanded chart with detail on hover
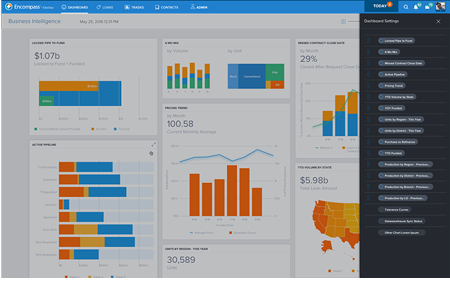
Dashboard with the Dashboard Settings panel open, listing the available charts
Dashboard settings for choosing charts
Next project